

Table of Contents
Highest Rental Yield Cities In India 2026: Where Cash Flow Beats Capital Gains

Would you rather own a property that doubles in 10 years but pays you nothing along the way, or one that grows more slowly but quietly fills your account every month?
If you’ve ever opened a property account statement expecting income and seen mostly paperwork, you already know the answer matters more than most coverage admits. Capital appreciation gets all the headlines, while rental yield gets treated as an afterthought. That works fine if you’re buying for self-use, or if you’re young and your wealth can wait. It works less well if you’re an NRI looking for repatriable INR income, an HNI building passive cash flow alongside a business, or a retiree positioning for the next 15 years.
For that kind of investor, the rental yield cities in India in 2026 matter as much as sometimes more than the appreciation leaders. If you’ve been following our appreciation-led analysis in Best Cities to Invest in Real Estate India 2026, think of this as the other half of the same conversation. This guide goes deep on the three Indian cities that are genuinely working for yield right now: Hyderabad, Pune, and Bengaluru’s Outer Ring Road belt. With verified 2026 data ranges (not single-point numbers that age badly), the methodology shown so you can re-run the math yourself, and an honest take on where each city wins.
A methodology note before we start: the yield ranges below are derived from current 2026 industry tracker reports, brokerage data, and listing platforms. Real estate dynamic ranges may shift over a 12-month horizon. We’ve kept ranges deliberately wide where the underlying data shows meaningful variance, and have flagged corridor-level differences where they matter.
1. Why Rental Yield Deserves More Attention Than It Gets

What does a property actually pay you while it’s growing and is that number large enough to matter to your monthly life?
Rental yield does four things capital appreciation can’t:
- It pays you while you wait. Appreciation is paper wealth until you sell. Yield is real money hitting your account every month.
- It funds your leverage. On a leveraged property, rent often covers a meaningful portion of the EMI, which means your asset is partly self-funding.
- It signals real demand. A market with healthy rental yield has actual tenants paying actual rent. A market with no yield but rising prices is a speculation market — which is fine when it’s working, dangerous when it stops.
- It compounds quietly. Reinvested rent over a decade materially changes total return, even on a “low-yield” 3.5% asset.
For NRIs specifically, yield matters for an extra reason: rental income is repatriable INR cash flow, subject to the standard NRO repatriation route. (For a breakdown of how that repatriation route actually works in 2026, see our Budget 2026 Property Rules: NRI Tax Guide.)
2. How Rental Yield Actually Works

Gross Yield vs Net Yield
This is where most coverage falls down. “Rental yield” in headlines usually means gross yield annual rent divided by property value. A 4% gross yield on a ₹2 crore property = ₹8 lakh of annual rent, or roughly ₹66,000 per month.
But that’s not what hits your account. Net yield subtracts:
- Maintenance / society charges: typically 0.5–1.5% of property value annually in premium projects
- Property tax: varies by municipality, usually 0.1–0.3% annually
- Vacancy: even strong markets see 1–2 months of vacancy in a typical 5-year cycle
- Repairs and tenant churn costs: averaging 0.3–0.5% annually
- Rental income tax: taxed in the landlord’s slab, with a standard 30% deduction available for repairs/maintenance under Section 24
Net yield in premium urban India typically lands 1–1.5 percentage points below gross yield. So that 4% gross yield is closer to a 2.5–3% net yield after costs and tax.
An Illustrative Cash-Flow Frame
To illustrate the math (not as a prediction): a ₹2 crore property at a midpoint 4% gross yield would generate roughly ₹8 lakh of annual gross rent. After typical expenses and the standard tax deduction, a landlord in a 30% slab might see somewhere in the range of ₹4.5–5.5 lakh of net cash flow annually, depending on the specifics.
That’s roughly ₹37,000–46,000 per month, net of everything, on a ₹2 crore deployment. Add in capital appreciation (say a conservative 8–10% in the cities below) and you’re compounding two return streams instead of one.
Why this framing matters: the cities below are evaluated on gross yield ranges, but the genuinely valuable yield markets are the ones where net yield after all costs still feels meaningful. All three cities below pass that test.
3. Hyderabad: The Balanced Yield Leader

The 2026 Yield Picture
Hyderabad has quietly become one of India’s strongest yield markets, partly because its property prices haven’t moved as aggressively as Mumbai’s or Gurugram’s, and partly because tenant demand from the IT and pharma corridors has stayed deep.
| Corridor | Gross Yield Range (2026) | Why It Works |
| Financial District / Nanakramguda | 3–5% (up to ~5.2% in HITEC City / Gachibowli per recent 2026 yield guides) | Direct IT corridor; metro Blue Line extension |
| Kokapet (Neopolis) | 3.5–4.5% | Hyderabad’s premium luxury hub; institutional anchor |
| Gachibowli | 3.5–4.5% (up to ~5.2% in select projects) | Established corporate core; rental values up materially recently |
| HITEC City | 3.5–4.5% (up to ~5.2% in select projects) | Mature IT base; dense tenant pool |
Recent industry reports also point to rental values in HITEC City and Gachibowli rising materially over the last 18 months 16% and 24% respectively which lifts the yield numbers above for newer leases.
Why Hyderabad’s Yield Math Holds Up
- Entry prices are lower than equivalent Bengaluru or Gurugram zones, which mathematically raises the rent-to-price ratio
- Tenant demand is dual-engine, IT plus pharma plus a fast-growing data-centre cluster
- TGRERA’s active enforcement keeps builder risk lower than other markets
- Sustained office leasing anchors residential rental demand
The Honest Risk
Hyderabad’s growth is geographically concentrated in the western corridor. A property in HITEC City or Kokapet works on yield. A property in older eastern or northern pockets often doesn’t have vacancy is higher, rent growth slower.
Who Hyderabad Suits
Investors wanting balanced returns, solid yield plus meaningful appreciation, at a lower entry price than tier-1 alternatives. Especially strong for NRIs and HNIs wanting tier-1 quality without tier-1 ticket sizes.
4. Pune: The Highest Pure-Yield Market
The 2026 Yield Picture
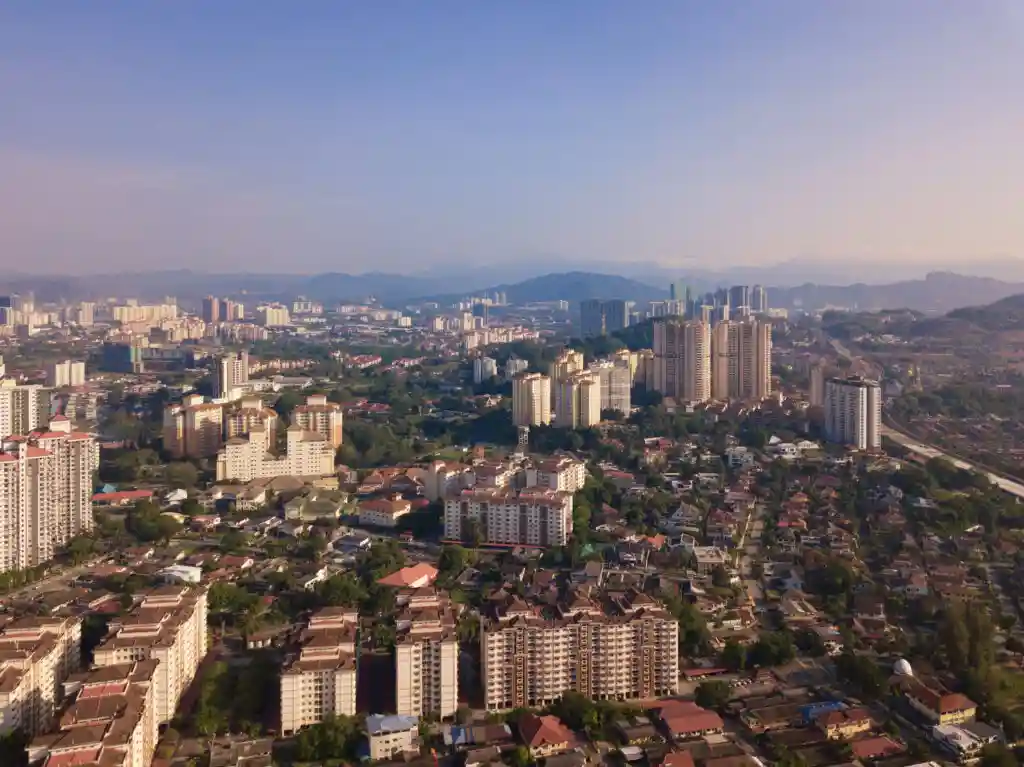
If Hyderabad is balanced, Pune is the pure-yield play. The combination of strong IT employment (Hinjewadi alone employs hundreds of thousands), tight rental supply, and reasonable property prices has pushed Pune IT corridors into among the highest gross-yield bands in tier-1 India comparable to certain niche luxury pockets in Mumbai-NCR, with deeper tenant volume.
| Corridor | Gross Yield Range (2026) | Notes |
| Hinjewadi (Phases 1–3) | 5–6% | Massive IT employment base; tightest rental supply |
| Kharadi | 4.5–6% (premium 6–8%) | EON IT Park, WTC; near airport |
| Wakad | 4.8–5.2% | Spillover from Hinjewadi; affordable entry |
| Magarpatta / Hadapsar | 4–5% | Mature SEZ; stable tenant pool |
| Baner / Balewadi | 3.5–4.5% | Premium residential; lower yield, higher appreciation |
Industry data also shows that furnished apartments in gated societies near Pune’s IT corridors generate 15–30% higher rent than unfurnished comparable units, pushing yields toward the upper end of these ranges. Rent in Hinjewadi rose roughly 17% over a recent nine-month window, indicating that supply hasn’t caught up with demand.
Why Pune Yields Are Genuinely High
- IT employment density in a relatively compact geography: short commutes from Hinjewadi/Wakad/Baner mean tenants pay a premium to live close
- Affordable property prices relative to rental demand: entry prices in Hinjewadi and Wakad are meaningfully lower than equivalent Bengaluru or Gurugram zones
- Co-living and PG demand from young IT professionals layers extra yield on top for investors willing to operate that model
The Honest Risk
Two specific cautions. First, water scarcity has emerged as a real issue in parts of East Pune (Kharadi, Keshavnagar, Wagholi), where societies depend on tanker water despite high property taxes to verify society-level water arrangements before committing. Second, Pune’s appreciation has historically been slower than Bengaluru or Hyderabad you’re optimising for yield here, not capital growth. Don’t expect both.
Who Pune Suits
Investors focused primarily on cash flow, NRIs wanting repatriable rental income, retirees positioning for passive income, or HNIs adding a yield-anchor to a portfolio that has appreciation exposure elsewhere.
5. Bengaluru ORR: The Stability Play

The 2026 Yield Picture
Bengaluru’s Outer Ring Road belt covering Marathahalli, Bellandur, Sarjapur, Whitefield-adjacent pockets is the most established yield market in India by tenant depth. The yields aren’t the highest, but they’re among the most predictable.
| Corridor | Gross Yield Range (2026) | Notes |
| ORR / Marathahalli | 3.5–4.5% | Highest residential rental growth in the city |
| Whitefield | 3.5–5% | Mature IT hub; metro Purple Line extension |
| Sarjapur Road | ~3% gross (improving) | 84% price growth over 3 years; yield compressed as prices rose |
| Bellandur | 3.5–4.5% | Tight supply near tech parks |
Why Bengaluru ORR Yield Is Different
The yield numbers above look modest next to Pune’s. But three things make Bengaluru ORR genuinely different:
- Tenant quality and depth: global IT captives, GCCs, mid-to-senior professionals. Vacancy in ORR corridors is structurally lower than other markets.
- Exit liquidity: Bengaluru has the deepest secondary buyer market in India for ₹1–4 crore properties. You can sell faster, and at less of a discount, than in any other major city.
- Rental escalation tracks reliably: annual rental increments of 8–10% are standard in ORR leases, which compounds the effective yield over time
The Honest Risk
Bengaluru’s recent inventory pile-up (highest quarterly inventory rise in tier-1 India in Q1 2026) means supply is rising. Over-supplied micro-markets can see yields compress further if absorption slows. Location-specific homework matters more in Bengaluru than in Hyderabad or Pune.
Who Bengaluru ORR Suits
Investors who value predictability over pure yield magnitude, NRIs wanting stable cash flow with low vacancy, professionals buying for eventual self-use with rental income in the interim, and anyone prioritising clean exit liquidity.
6. Three-City Comparison: Where Cash Flow Beats Capital Gains

Based on Q1–Q2 2026 industry data:
| Factor | Hyderabad | Pune | Bengaluru ORR |
| Typical gross yield (premium corridors) | 3.5–5% (up to ~5.2% in select pockets) | 4.5–6% | 3.5–4.5% |
| Best-yielding pocket | Financial District / Gachibowli | Hinjewadi / Kharadi | Marathahalli / ORR |
| Tenant base | IT + pharma + data centres | IT (deep, single-engine) | IT + global captives |
| Vacancy risk | Low–moderate | Low | Lowest |
| Appreciation alongside yield | Strong (12–15% in premium) | Modest (6–9%) | Steady (10–12%) |
| Exit liquidity | Improving rapidly | Moderate | Strongest |
| Key risk | Geographic concentration in west | Water; modest appreciation | Inventory rising |
| Best for | Balanced yield + growth | Pure cash flow | Stable yield + clean exits |
The pattern: Pune for the highest gross yield, Hyderabad for the best yield-plus-appreciation balance, Bengaluru ORR for the most predictable yield with the cleanest exit.
The Allocation Frame
If you’re deploying ₹2–5 crore primarily for cash flow:
- Pure yield-maximiser: Concentrate in Pune (Hinjewadi/Kharadi), accepting modest appreciation in exchange for the highest gross yield band
- Yield-plus-growth investor: Split between Hyderabad’s Financial District/Kokapet and Bengaluru ORR, meaningful yield, real appreciation, strong exit liquidity
- Conservative yield investor: Bengaluru ORR (Marathahalli/Whitefield), prioritising predictability and exit ease over absolute yield magnitude
For Brokers and Agents Working With Yield-Focused Clients
If you’re advising NRI or HNI clients whose primary goal is monthly cash flow rather than capital gains, this three-city lens is a clean way to match city-mix to client-goals: Pune for clients who want the highest absolute yield, Hyderabad for clients who want balance, Bengaluru ORR for clients who prioritise stability and clean exits. Most ₹1Cr+ buyers don’t articulate it as “yield vs appreciation” they’ll say “I want a good investment” but framing the conversation this way gets you to the right city-recommendation faster.
7. Frequently Asked Questions
Q1. Which Indian city has the highest rental yield in 2026?
Among tier-1 cities, Pune offers the highest gross rental yields, with IT corridors like Hinjewadi and Kharadi typically in the 5–6% band (and premium furnished properties in Kharadi reaching 6–8%). Hyderabad’s premium corridors yield 3.5–5% (up to ~5.2% in HITEC City and Gachibowli), Bengaluru ORR 3.5–4.5%.
Q2. What is the average rental yield in India in 2026?
Average residential rental yields across tier-1 Indian cities currently range from 2.5% to 5%, depending on city, corridor, and property type. Premium urban properties typically deliver 3.5–4.5%, while specific high-demand IT corridors in Pune can reach 5–6%.
Q3. What is the difference between gross and net rental yield?
Gross yield is annual rent divided by property value. Net yield subtracts maintenance, property tax, vacancy, repairs, and tenant tax typically reducing the headline yield by 1–1.5 percentage points. A 4% gross yield often translates to a 2.5–3% net yield after all costs.
Q4. Is Hyderabad better than Bengaluru for rental income in 2026?
Hyderabad offers slightly higher gross yields (3.5–5% in premium corridors, up to ~5.2% in HITEC City/Gachibowli) compared to Bengaluru ORR (3.5–4.5%), and currently has stronger appreciation alongside the yield. Bengaluru ORR offers more predictable yield with the deepest exit liquidity. The right answer depends on whether you prioritise yield magnitude or yield stability.
Q5. Are Pune’s high yields sustainable?
Pune’s IT corridor yields (5–6%) are anchored by structural factors: high IT employment density, tight rental supply, and lower entry prices than Bengaluru/Hyderabad. Provided IT employment in Hinjewadi and Kharadi remains stable, the yield band looks structurally defensible. The bigger risk is appreciation lagging, not yield collapsing.
Q6. What’s a reasonable rental yield target for ₹1Cr+ property in 2026?
A realistic gross yield target across the cities covered here is 3.5–5% for premium urban property. Anything claiming higher than 6% in a premium tier-1 corridor should be verified carefully either it’s a special use case (co-living, serviced apartments), or the price is below market for a reason.
Q7. How do NRIs receive rental income from Indian property?
Rental income from Indian property is generally credited to your NRO account, taxable in India, and repatriable abroad up to USD 1 million per financial year per individual (subject to FEMA and full tax compliance). Form 15CA and 15CB are needed for the outward remittance. For the full repatriation walkthrough, see our Budget 2026 Property Rules: NRI Tax Guide.
Q8. Should I prioritise rental yield or capital appreciation in 2026?
Both, but in proportion to your goals. If you need monthly cash flow (NRIs, retirees, passive-income investors), tilt toward Pune and Hyderabad. If you’re building long-term wealth and don’t need cash flow yet, tilt toward Gurugram and Bengaluru. For most ₹1Cr+ portfolios, the right answer is a split across cities see our Best Cities to Invest in Real Estate India 2026 deep-dive for the appreciation-focused side of this conversation.
A Final Word
Capital appreciation gets the headlines because it’s a single big number you can point to. Rental yield gets ignored because it’s a smaller number that quietly does its work in the background. But over a 10-year hold, the investor who optimised for both yield and appreciation almost always ends up further ahead than the one who chased appreciation alone.
The 2026 picture for yield-focused investors is genuinely clean: Pune for the highest gross yields, Hyderabad for the cleanest balance of yield and growth, Bengaluru ORR for the most predictable yield with the easiest exit. Each one is doing a different job. None of them is wrong, they’re just suited to different investor goals.
At Aurex, this is the conversation we have with HNI and NRI clients who care about monthly cash flow as much as long-term appreciation matching city, corridor, and project to a yield goal that’s specific and realistic.
General information only, reflecting verified 2026 market data. Real estate yields and prices are dynamic and may shift. Not investment advice.
Socialize With Us:-
Facebook | Instagram | LinkedIn | Youtube | X (Twitter)
Find More Interesting Projects – Click Here